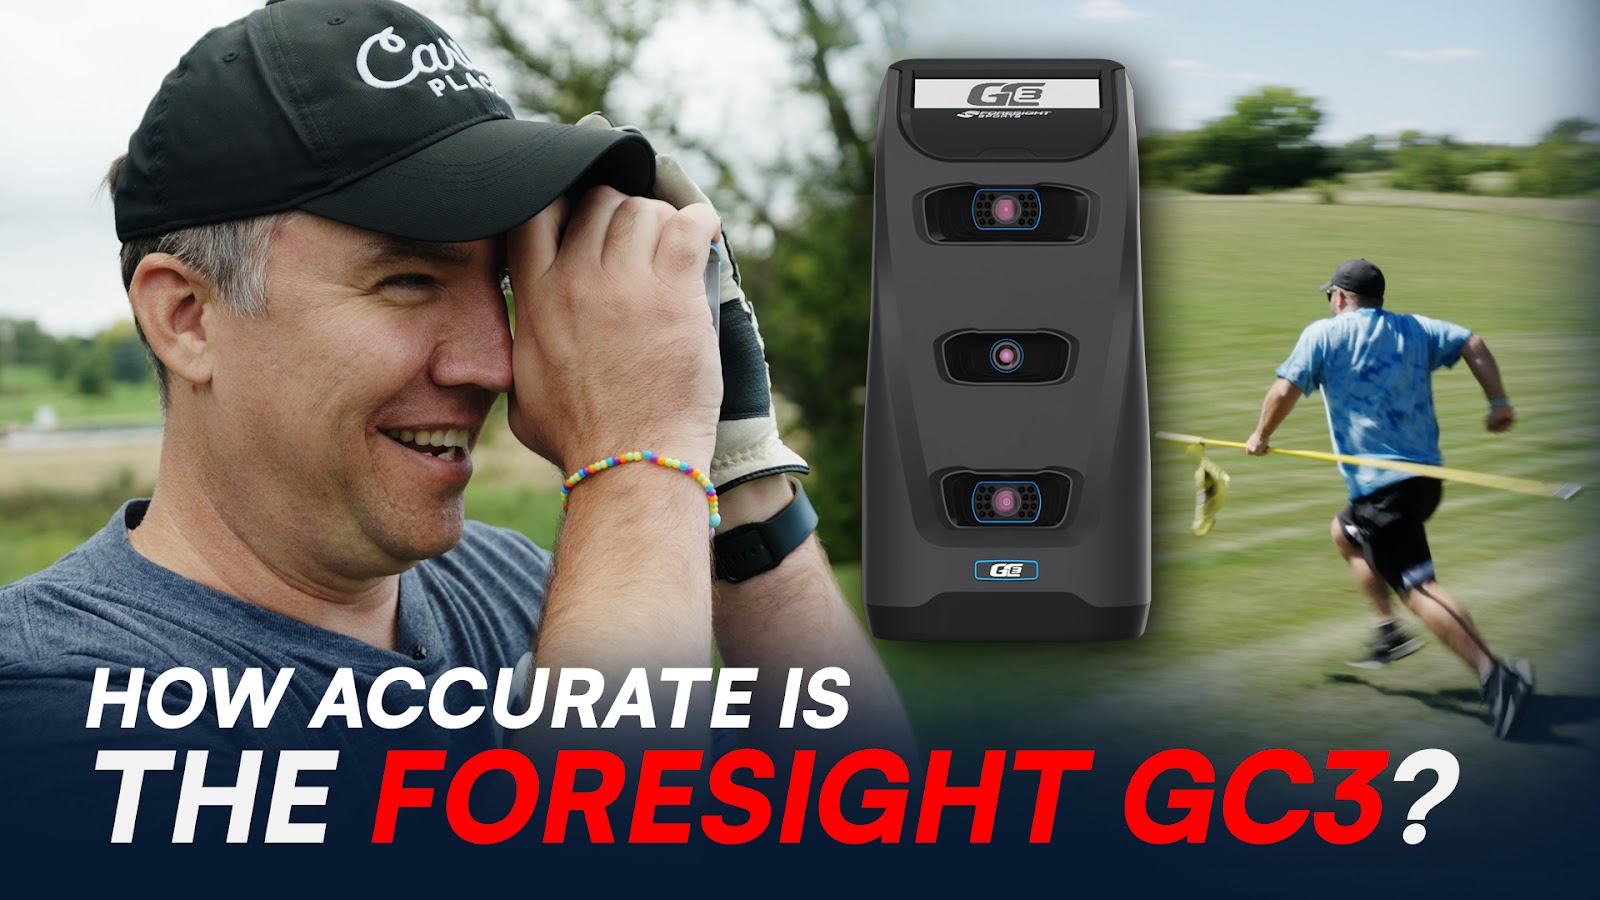
The Foresight GC3 launch monitor has been a popular option for golfers looking for top-notch accuracy for years. And after our late summer 2023 field test, we can see exactly why.

Simply put: in our outdoor launch monitor accuracy tests, Foresight’s GC3 was the most accurate launch monitor we’ve tested. Those range tests included:

Getting Started With Our GC3 Accuracy Test
The GC3 was super easy to take out and use at the driving range. It’s small and portable, and the fact that the numbers show up right on the unit itself means you don’t even need to connect it to a mobile device to get your data.
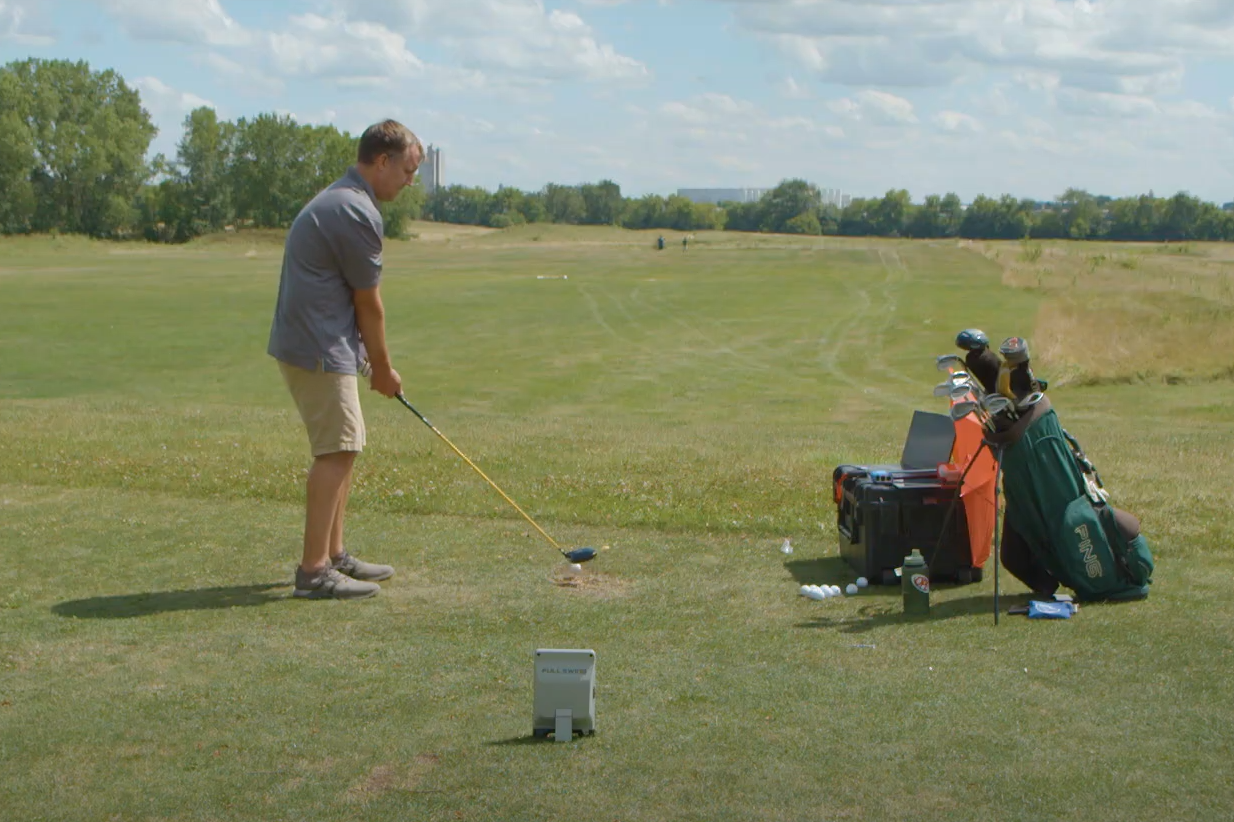
Our goal at the range was to compare the carry distance from the launch monitor with the carry distance measured by a rangefinder in real life. Too many other factors play into calculating other data, so we stuck with the one we know we can measure pretty accurately.
As with the rest of our driving range accuracy tests, we had Tim from our customer service team hit 20 shots with a driver, 6 iron and pitching wedge. Mike from the Carl’s Place marketing team was out chasing down and marking the balls, and then Tim would use the rangefinder to shoot Mike to get the real life distance.
As always with outdoor tests, there were a range of factors that could have affected the data:
- The weather is almost always going to play a factor. However, this test day was maybe the calmest and best weather day of any that we’ve had for testing.
- Our tee area is slightly elevated compared to the rest of the range.
- Plus, Mike sometimes runs out of gas chasing down the balls and might miss marking a ball by a couple yards.
GC3 Accuracy Test Results
DRIVER DATA
Driver is a tough club for launch monitors to read because of the high club and ball speeds, but the GC3 didn’t seem to have much of a problem.
There were just two shots that were more than 10 yards off, but the other 18 shots were all within 8 yards of the real life distance.
The driver data was off an average of just 4.4 yards, which came out to be just over 2%. That’s really accurate, especially when compared to our other tests.
|
Shot
|
Real Life Carry Distance
|
Simulator Carry Distance
|
Yardage Difference
|
Percentage Difference
|
|
Shot 1
|
239
|
237
|
2
|
0.84%
|
|
Shot 2
|
235
|
231
|
4
|
1.70%
|
|
Shot 3
|
243
|
243
|
0
|
0.00%
|
|
Shot 4
|
228
|
227
|
1
|
0.44%
|
|
Shot 5
|
224
|
220
|
4
|
1.79%
|
|
Shot 6
|
218
|
215
|
3
|
1.38%
|
|
Shot 7
|
227
|
227
|
0
|
0.00%
|
|
Shot 8
|
240
|
242
|
2
|
0.83%
|
|
Shot 9
|
222
|
215
|
7
|
3.15%
|
|
Shot 10
|
219
|
214
|
5
|
2.28%
|
|
Shot 11
|
235
|
235
|
0
|
0.00%
|
|
Shot 12
|
218
|
200
|
18
|
8.26%
|
|
Shot 13
|
215
|
210
|
5
|
2.33%
|
|
Shot 14
|
223
|
236
|
13
|
5.83%
|
|
Shot 15
|
232
|
232
|
0
|
0.00%
|
|
Shot 16
|
224
|
224
|
0
|
0.00%
|
|
Shot 17
|
192
|
197
|
5
|
2.60%
|
|
Shot 18
|
229
|
225
|
4
|
1.75%
|
|
Shot 19
|
230
|
223
|
7
|
3.04%
|
|
Shot 20
|
183
|
175
|
8
|
4.37%
|
| |
|
Average
|
4.4
|
2.03%
|
6 IRON DATA
All you need to do is look at the first 9 shots from the 6 iron. They were off by just 9 yards - COMBINED. That’s unbelievable.
We started seeing a little more fluctuation in the data after those 9 shots, but overall, it was still extremely accurate, averaging just 2.3 yards, or 1.29%, off from real life numbers.
|
Shot
|
Real Life Carry Distance
|
Simulator Carry Distance
|
Yardage Difference
|
Percentage Difference
|
|
Shot 1
|
160
|
160
|
0
|
0.00%
|
|
Shot 2
|
179
|
180
|
1
|
0.56%
|
|
Shot 3
|
183
|
184
|
1
|
0.55%
|
|
Shot 4
|
171
|
170
|
1
|
0.58%
|
|
Shot 5
|
186
|
185
|
1
|
0.54%
|
|
Shot 6
|
174
|
172
|
2
|
1.15%
|
|
Shot 7
|
168
|
165
|
3
|
1.79%
|
|
Shot 8
|
177
|
177
|
0
|
0.00%
|
|
Shot 9
|
179
|
179
|
0
|
0.00%
|
|
Shot 10
|
182
|
177
|
5
|
2.75%
|
|
Shot 11
|
180
|
180
|
0
|
0.00%
|
|
Shot 12
|
176
|
172
|
4
|
2.27%
|
|
Shot 13
|
188
|
182
|
6
|
3.19%
|
|
Shot 14
|
181
|
181
|
0
|
0.00%
|
|
Shot 15
|
174
|
170
|
4
|
2.30%
|
|
Shot 16
|
168
|
170
|
2
|
1.19%
|
|
Shot 17
|
188
|
188
|
0
|
0.00%
|
|
Shot 18
|
180
|
174
|
6
|
3.33%
|
|
Shot 19
|
180
|
173
|
7
|
3.89%
|
|
Shot 20
|
179
|
182
|
3
|
1.68%
|
| |
|
Average
|
2.3
|
1.29%
|
PITCHING WEDGE DATA
Unlike the start to the 6 iron data, the pitching wedge had an odd first shot with 10 yards of difference.
But from then on, it was fantastic. It was exact for five straight shots!
Overall, just 1.75 yards of difference, which was 1.44%. Pretty phenomenal.
|
Shot
|
Real Life Carry Distance
|
Simulator Carry Distance
|
Yardage Difference
|
Percentage Difference
|
|
Shot 1
|
128
|
138
|
10
|
7.81%
|
|
Shot 2
|
118
|
118
|
0
|
0.00%
|
|
Shot 3
|
132
|
128
|
4
|
3.03%
|
|
Shot 4
|
125
|
122
|
3
|
2.40%
|
|
Shot 5
|
117
|
114
|
3
|
2.56%
|
|
Shot 6
|
124
|
124
|
0
|
0.00%
|
|
Shot 7
|
129
|
128
|
1
|
0.78%
|
|
Shot 8
|
117
|
115
|
2
|
1.71%
|
|
Shot 9
|
117
|
117
|
0
|
0.00%
|
|
Shot 10
|
124
|
124
|
0
|
0.00%
|
|
Shot 11
|
127
|
127
|
0
|
0.00%
|
|
Shot 12
|
119
|
119
|
0
|
0.00%
|
|
Shot 13
|
126
|
126
|
0
|
0.00%
|
|
Shot 14
|
122
|
121
|
1
|
0.82%
|
|
Shot 15
|
114
|
114
|
0
|
0.00%
|
|
Shot 16
|
121
|
122
|
1
|
0.83%
|
|
Shot 17
|
123
|
120
|
3
|
2.44%
|
|
Shot 18
|
102
|
100
|
2
|
1.96%
|
|
Shot 19
|
112
|
116
|
4
|
3.57%
|
|
Shot 20
|
122
|
121
|
1
|
0.82%
|
| |
|
Average
|
1.75
|
1.44%
|
Conclusion
So, knowing the Foresight GC3 price, what do we think? Is it worth that cost?
If we’re speaking strictly on accuracy, heck yes it is. When you hear the Foresight name, you expect greatness. Well, the GC3 launch monitor might have surpassed that. Plus, you can add in the bonus features of how portable the unit is and how you can see your numbers directly on the unit without having to connect a mobile device.
The Foresight GC3 might not be the least expensive launch monitor, but it has proven to be the most accurate.


