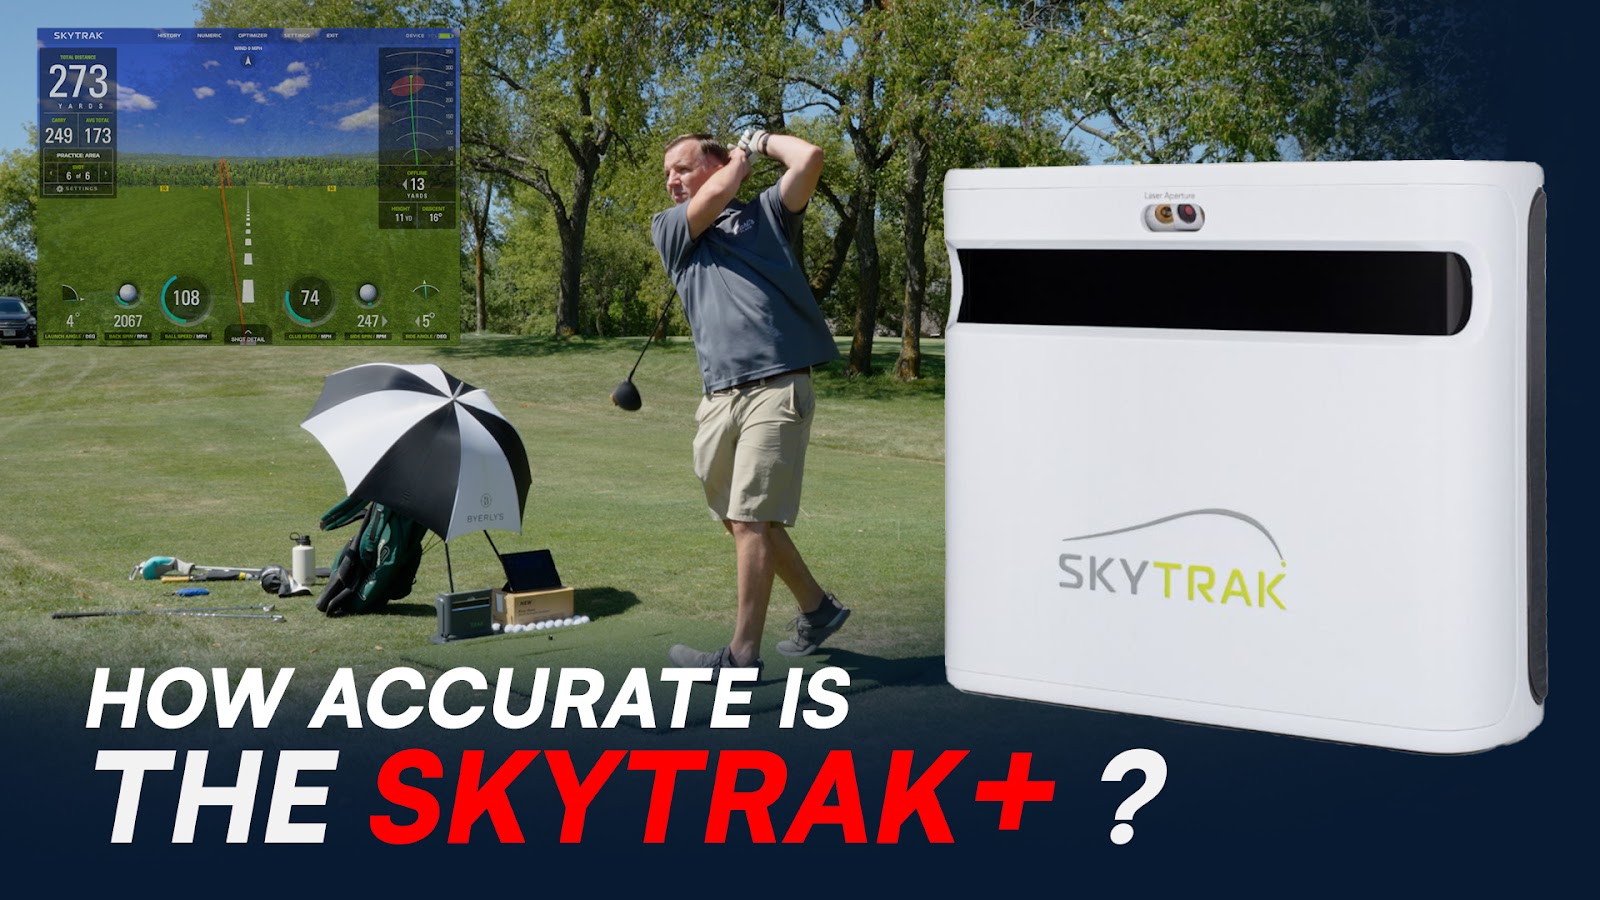
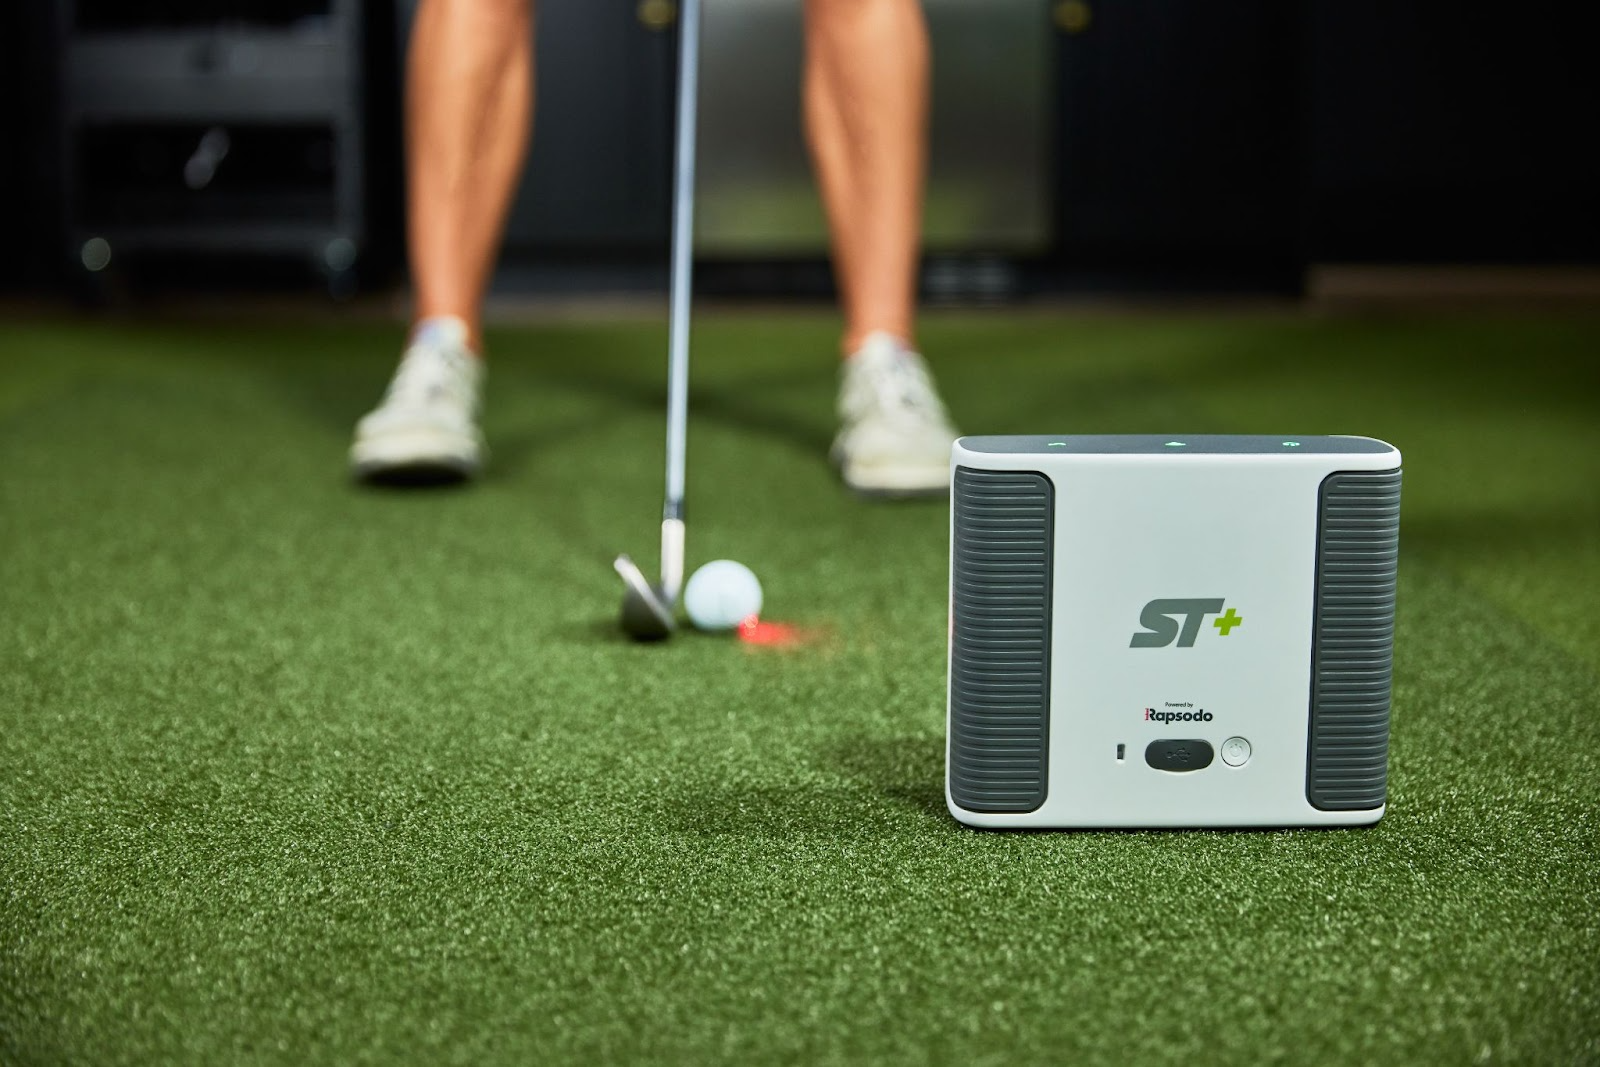
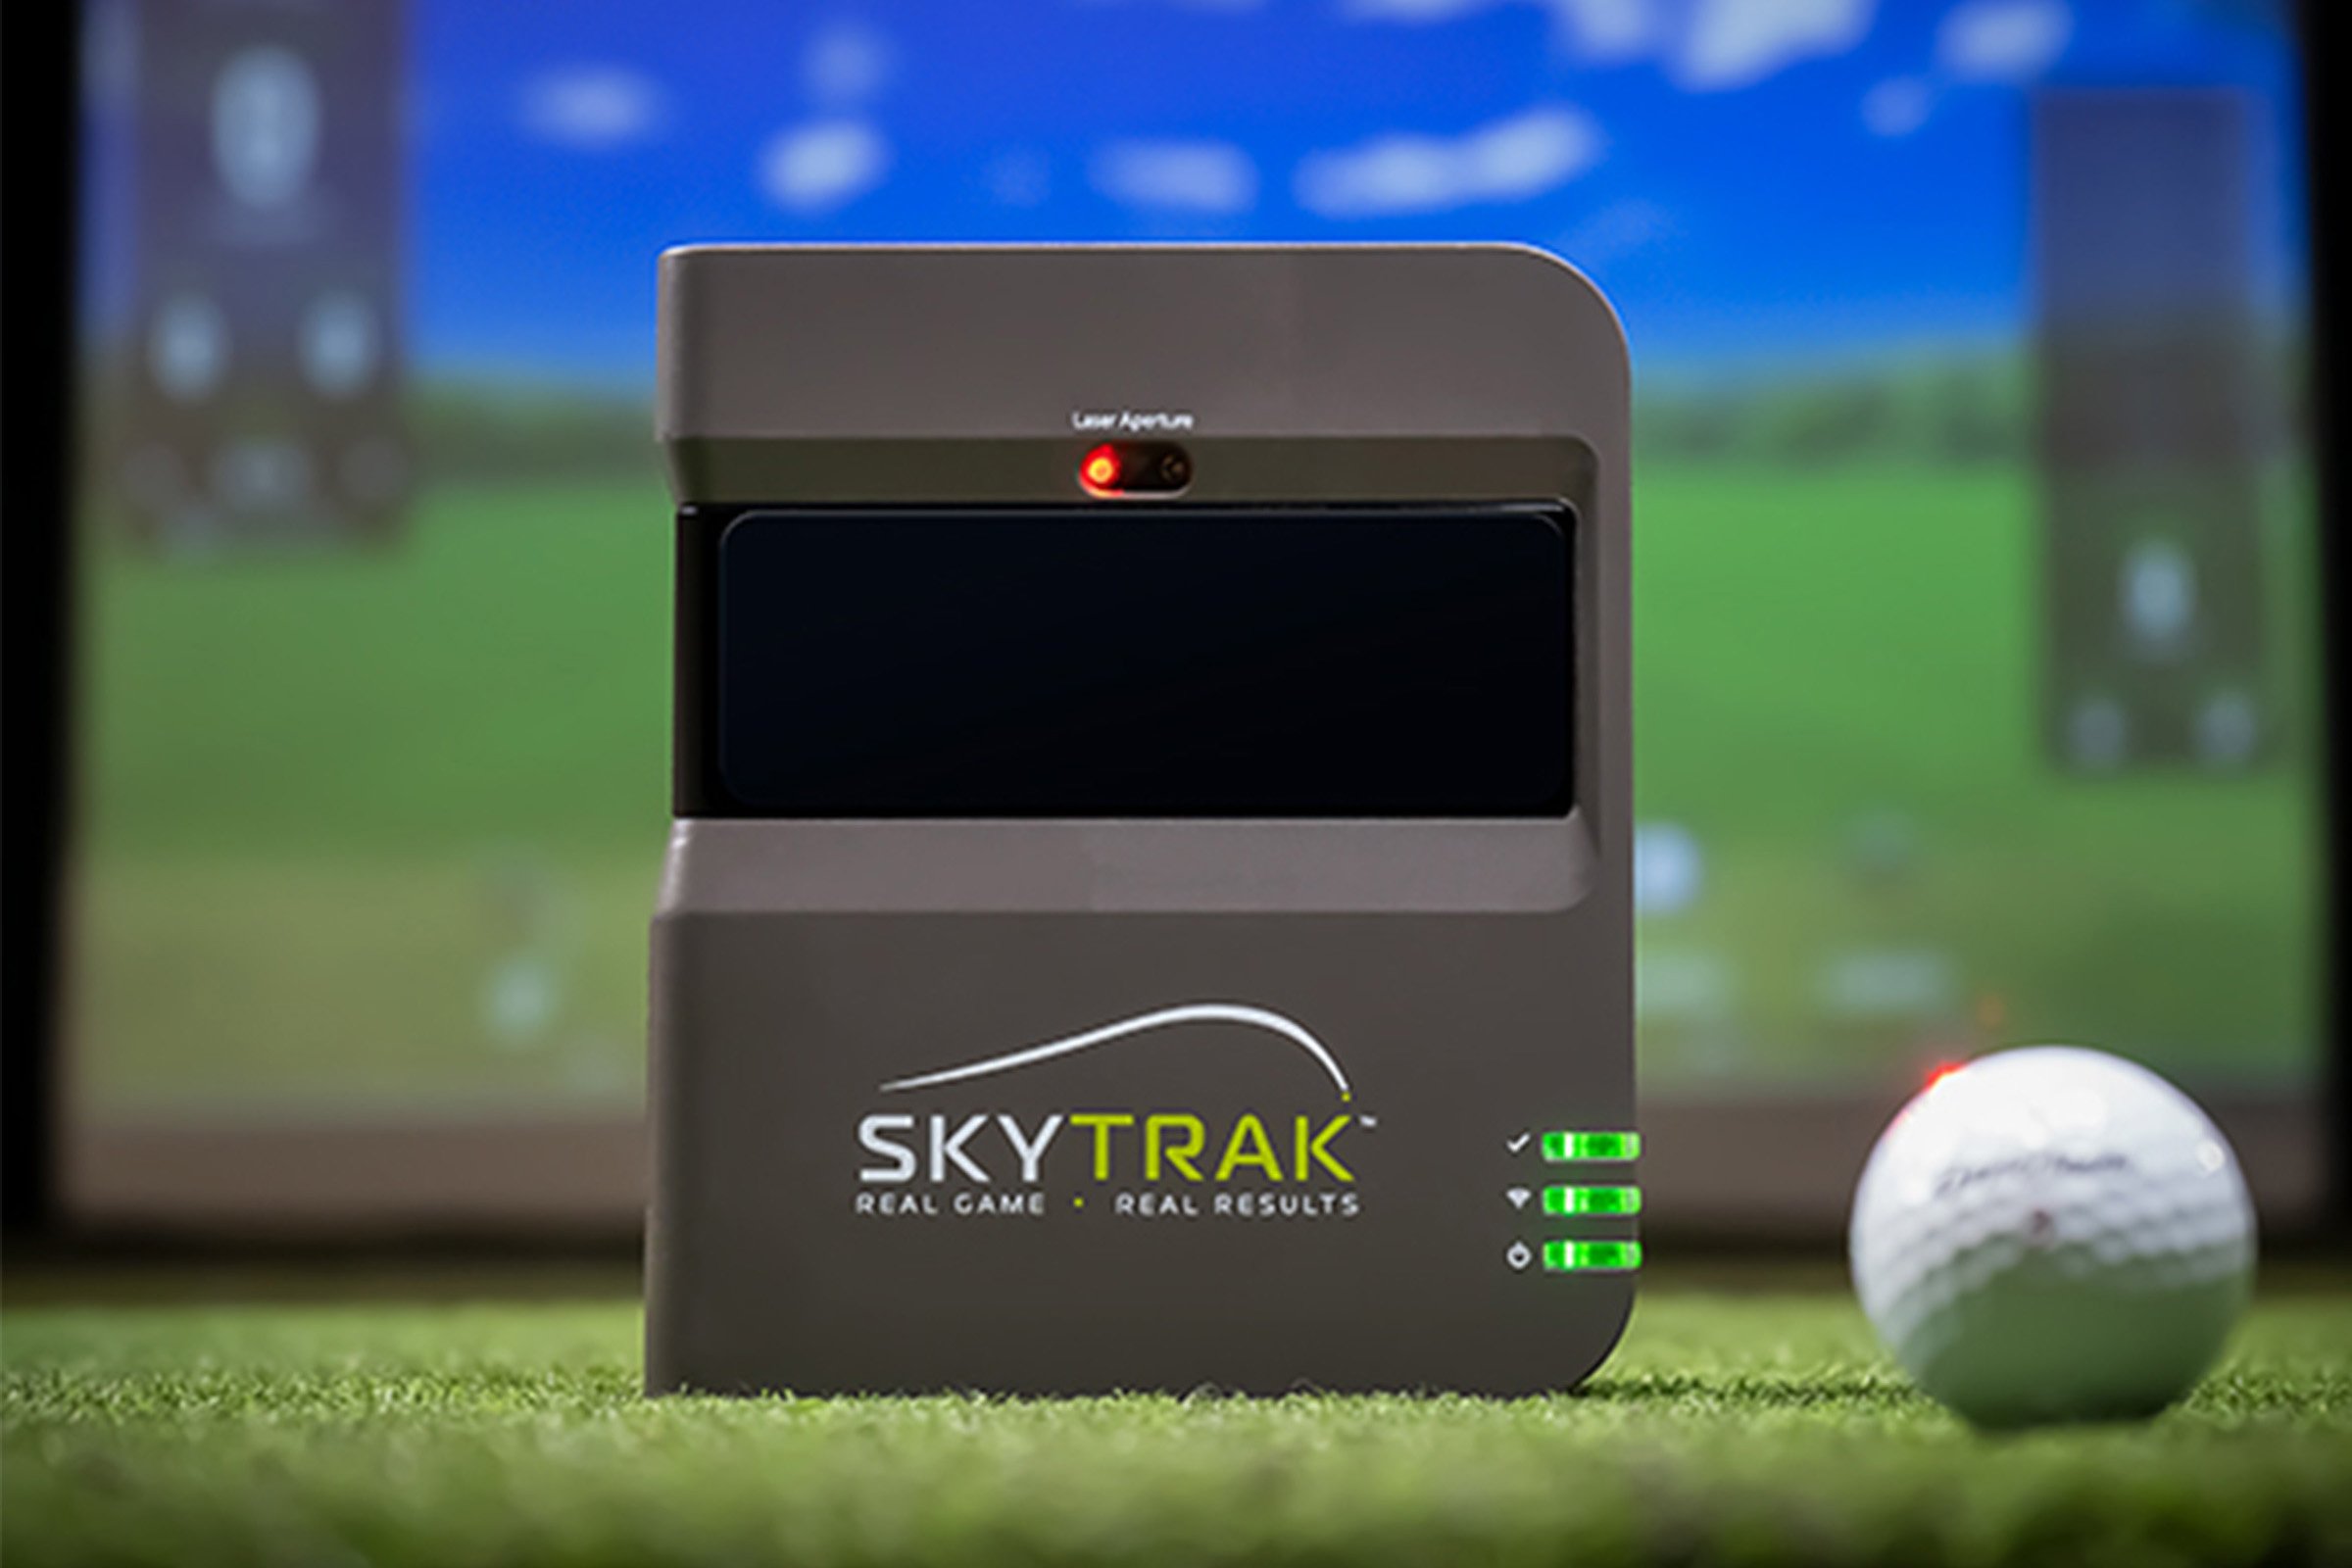
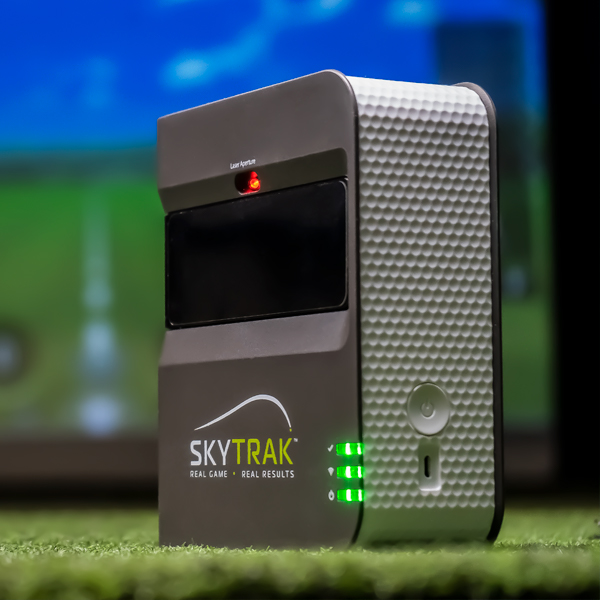
The original SkyTrak launch monitor was one of the first we took to the range to test its accuracy. SkyTrak has since released the upgraded SkyTrak+, which boasts a dual doppler radar system and proprietary machine-learning software to offer top-notch accuracy for the price.

So, in true Carl’s Place fashion, we put it to the test against the real life numbers at the driving range. Good news: the SkyTrak+, while larger than the original unit, is still very portable and easy to get set up outdoors at the range.
As with all our tests, we have Tim from our customer service team take 20 shots with a driver, 6 iron and pitching wedge. Mike from the marketing team is out in the field tracking down and marking the carry distance of each shot. Tim then uses a rangefinder to shoot Mike to get the real life number and compare it to the launch monitor number.
Keep in mind, there are a range of factors that can affect numbers at the driving range. Those factors include: weather, an elevated tee area, and human error on the ball spotting.
All our data collected is below. And if you’d like, check out our other driving range accuracy tests at the links below:
 SkyTrak+ Accuracy Test Results
DRIVER DATA
With just about every launch monitor test we’ve done, driver data has shown the most variance. No difference here with the SkyTrak+. The first 11 shots or so were somewhat inconsistent, but then it dialed in and was pretty darn accurate.
The last 9 shots were all within 6 yards of the real life number, which helped bring the average yardage difference to just under 10 yards, which was 4.38% off. Overall, not too bad, especially for the higher club and ball speeds from a driver.
|
Shot
|
Real Life Carry Distance
|
Simulator Carry Distance
|
Yardage Difference
|
Percentage Difference
|
|
Shot 1
|
220
|
233
|
13
|
5.91%
|
|
Shot 2
|
243
|
213
|
30
|
12.35%
|
|
Shot 3
|
215
|
212
|
3
|
1.40%
|
|
Shot 4
|
239
|
252
|
13
|
5.44%
|
|
Shot 5
|
242
|
235
|
7
|
2.89%
|
|
Shot 6
|
242
|
249
|
7
|
2.89%
|
|
Shot 7
|
232
|
220
|
12
|
5.17%
|
|
Shot 8
|
232
|
221
|
11
|
4.74%
|
|
Shot 9
|
213
|
176
|
37
|
17.37%
|
|
Shot 10
|
216
|
201
|
15
|
6.94%
|
|
Shot 11
|
215
|
236
|
21
|
9.77%
|
|
Shot 12
|
232
|
238
|
6
|
2.59%
|
|
Shot 13
|
249
|
247
|
2
|
0.80%
|
|
Shot 14
|
241
|
242
|
1
|
0.41%
|
|
Shot 15
|
212
|
214
|
2
|
0.94%
|
|
Shot 16
|
233
|
235
|
2
|
0.86%
|
|
Shot 17
|
248
|
244
|
4
|
1.61%
|
|
Shot 18
|
241
|
242
|
1
|
0.41%
|
|
Shot 19
|
234
|
229
|
5
|
2.14%
|
|
Shot 20
|
205
|
199
|
6
|
2.93%
|
| |
|
Average
|
9.9
|
4.38%
|
6 IRON DATA
Tim’s 6 iron wielded some different results than the driver.
Just two shots were more than 10 yards off, and the rest were within 7 yards of the real life distance.
That added up to be 4.5 yards different on average, or an impressive 2.52%.
|
Shot
|
Real Life Carry Distance
|
Simulator Carry Distance
|
Yardage Difference
|
Percentage Difference
|
|
Shot 1
|
174
|
178
|
4
|
2.30%
|
|
Shot 2
|
190
|
185
|
5
|
2.63%
|
|
Shot 3
|
184
|
159
|
25
|
13.59%
|
|
Shot 4
|
184
|
186
|
2
|
1.09%
|
|
Shot 5
|
144
|
142
|
2
|
1.39%
|
|
Shot 6
|
169
|
174
|
5
|
2.96%
|
|
Shot 7
|
181
|
192
|
11
|
6.08%
|
|
Shot 8
|
182
|
184
|
2
|
1.10%
|
|
Shot 9
|
170
|
173
|
3
|
1.76%
|
|
Shot 10
|
180
|
180
|
0
|
0.00%
|
|
Shot 11
|
182
|
186
|
4
|
2.20%
|
|
Shot 12
|
166
|
169
|
3
|
1.81%
|
|
Shot 13
|
199
|
203
|
4
|
2.01%
|
|
Shot 14
|
176
|
183
|
7
|
3.98%
|
|
Shot 15
|
189
|
190
|
1
|
0.53%
|
|
Shot 16
|
194
|
195
|
1
|
0.52%
|
|
Shot 17
|
171
|
177
|
6
|
3.51%
|
|
Shot 18
|
173
|
172
|
1
|
0.58%
|
|
Shot 19
|
179
|
182
|
3
|
1.68%
|
|
Shot 20
|
157
|
156
|
1
|
0.64%
|
| |
|
Average
|
4.5
|
2.52%
|
PITCHING WEDGE DATA
Although not as strong as the 6 iron data, the numbers for the pitching wedge were also pretty solid. Only one shot was more than 10 yards off.
The other 19 shots were all within 7 yards, which helped the average yardage difference be just 3.95, or 3.5%.
|
Shot
|
Real Life Carry Distance
|
Simulator Carry Distance
|
Yardage Difference
|
Percentage Difference
|
|
Shot 1
|
128
|
125
|
3
|
2.34%
|
|
Shot 2
|
118
|
118
|
0
|
0.00%
|
|
Shot 3
|
122
|
119
|
3
|
2.46%
|
|
Shot 4
|
111
|
116
|
5
|
4.50%
|
|
Shot 5
|
120
|
113
|
7
|
5.83%
|
|
Shot 6
|
94
|
91
|
3
|
3.19%
|
|
Shot 7
|
131
|
130
|
1
|
0.76%
|
|
Shot 8
|
123
|
122
|
1
|
0.81%
|
|
Shot 9
|
114
|
120
|
6
|
5.26%
|
|
Shot 10
|
112
|
114
|
2
|
1.79%
|
|
Shot 11
|
109
|
109
|
0
|
0.00%
|
|
Shot 12
|
117
|
105
|
12
|
10.26%
|
|
Shot 13
|
122
|
120
|
2
|
1.64%
|
|
Shot 14
|
113
|
110
|
3
|
2.65%
|
|
Shot 15
|
105
|
110
|
5
|
4.76%
|
|
Shot 16
|
109
|
116
|
7
|
6.42%
|
|
Shot 17
|
106
|
109
|
3
|
2.83%
|
|
Shot 18
|
113
|
119
|
6
|
5.31%
|
|
Shot 19
|
107
|
112
|
5
|
4.67%
|
|
Shot 20
|
110
|
115
|
5
|
4.55%
|
| |
|
Average
|
3.95
|
3.50%
|
CONCLUSION
When comparing the accuracy tests of the SkyTrak+ and original SkyTrak, you’ll see the company did a great job of increasing its accuracy and making it an even better value for its price point.
Getting this accuracy - an average of 3.47% off amongst the 60 shots - and the new data points the SkyTrak+ provides is hard to beat at its affordable price.


