For years, Uneekor was known for overhead launch monitors - devices that were ceiling-mounted and great for high-end indoor golf simulators, but not portable enough to take to the driving range.

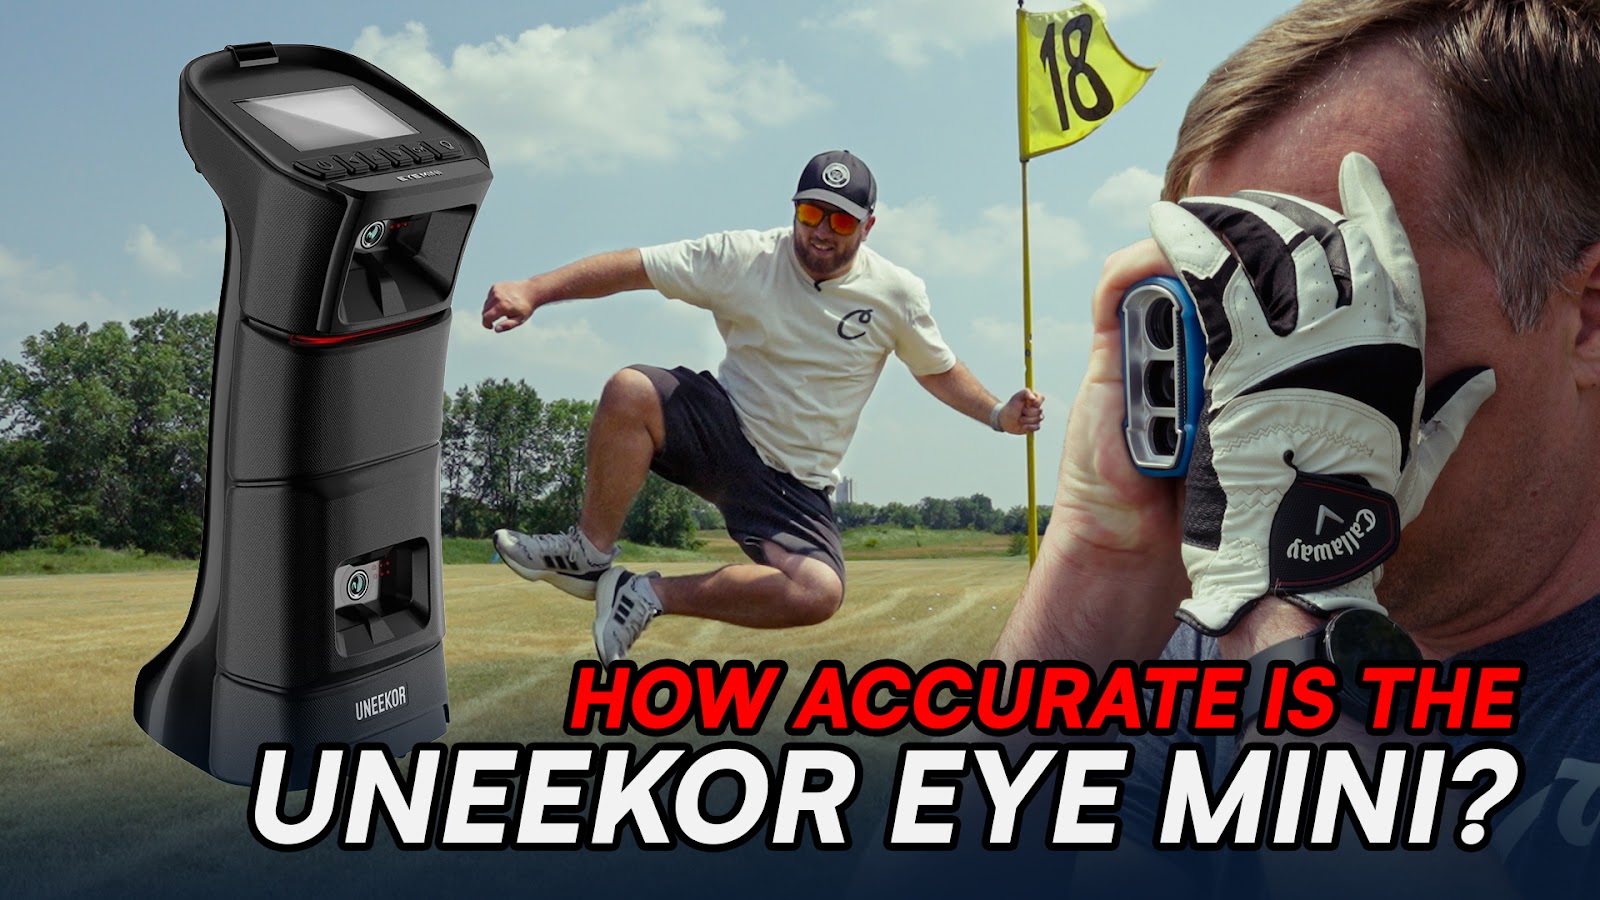
That was until the spring of 2023 when it launched a new floor mounted option, the Uneekor EYE MINI. So, naturally, Carl’s Place had to put it to the test at the driving range to see how accurate the data was compared to real life driving range numbers.
We’ve done this with a number of other portable launch monitors, including the:

Setting Up the EYE MINI Accuracy Test
Our primary objective at the range was to compare the carry distance obtained from the EYE MINI launch monitor and the carry distance measured by a rangefinder in real-life. Considering the multitude of factors that can influence other data calculations, we opted to focus on the one measurement that we can confidently and accurately determine.
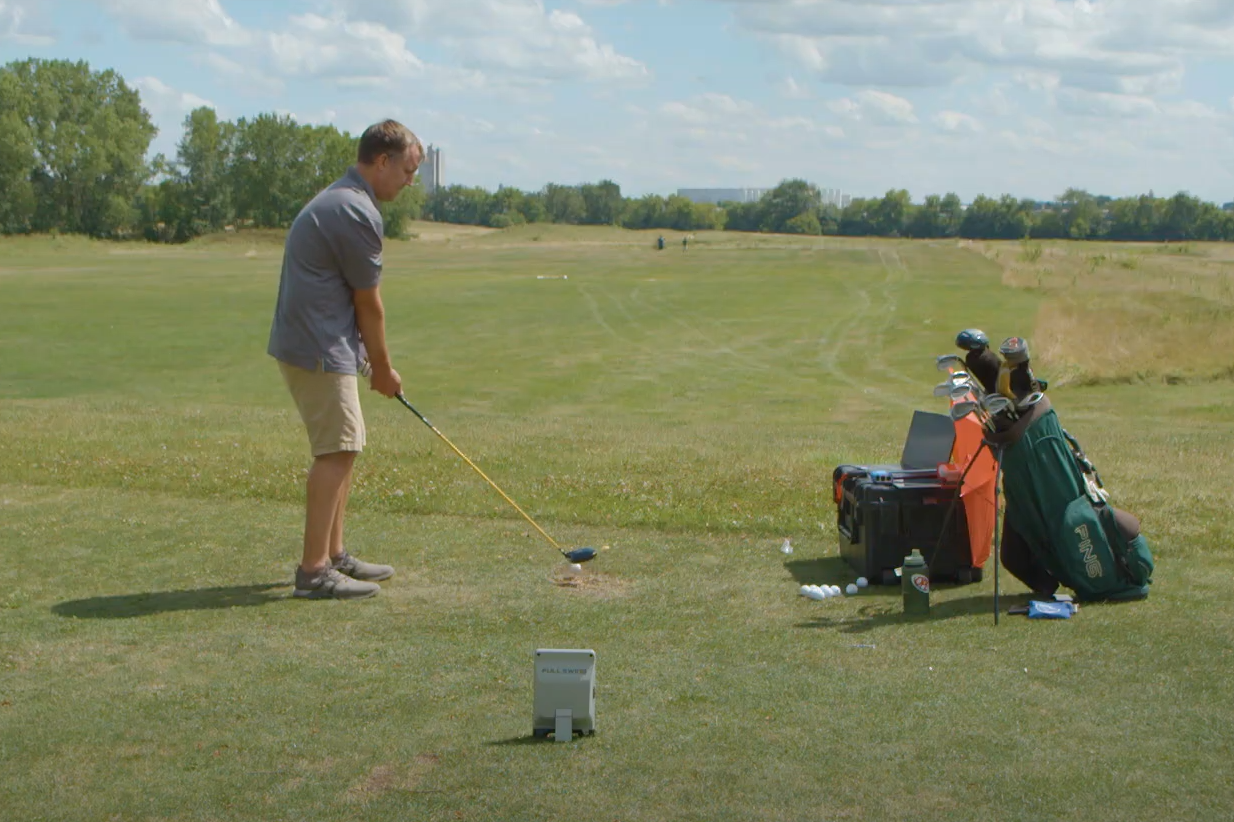
Following the same approach as our previous driving range accuracy tests, we enlisted the expertise and gorgeous swing of Tim, a member of our customer service team, to hit a total of 60 shots - 20 shots each with a driver, 6 iron, and pitching wedge. Mike, of the Carl's Place marketing team, tracked and marked each ball, while Tim then used the rangefinder and capture the true distance.
As is customary with outdoor tests, there are various factors that could potentially impact the data: weather, an elevated tee, and human error with ball spotting. It is important to acknowledge that due to the physical demands of chasing down the balls, there may have been instances where Mike, in his tireless pursuit, inadvertently missed marking a ball by a few yards.
EYE MINI ACCURACY TEST RESULTS
DRIVER DATA
The driver data with the Uneekor EYE MINI was hit or miss. There was a string of shots early on that were quite accurate, but then some were upwards of 30 yards off. Some of that could likely be attributed to the windy conditions we had to work with on test day.
Overall, the average yardage difference came out to be 11.65 yards, or 5.61%.
|
Shot
|
Real Life Carry Distance
|
Simulator Carry Distance
|
Yardage Difference
|
Percentage Difference
|
|
Shot 1
|
204
|
171
|
33
|
16.18%
|
|
Shot 2
|
246
|
235
|
11
|
4.47%
|
|
Shot 3
|
234
|
219
|
15
|
6.41%
|
|
Shot 4
|
214
|
200
|
14
|
6.54%
|
|
Shot 5
|
233
|
233
|
0
|
0.00%
|
|
Shot 6
|
210
|
215
|
5
|
2.38%
|
|
Shot 7
|
196
|
197
|
1
|
0.51%
|
|
Shot 8
|
246
|
252
|
6
|
2.44%
|
|
Shot 9
|
238
|
239
|
1
|
0.42%
|
|
Shot 10
|
177
|
200
|
23
|
12.99%
|
|
Shot 11
|
206
|
200
|
6
|
2.91%
|
|
Shot 12
|
207
|
225
|
18
|
8.70%
|
|
Shot 13
|
178
|
165
|
13
|
7.30%
|
|
Shot 14
|
203
|
206
|
3
|
1.48%
|
|
Shot 15
|
193
|
197
|
4
|
2.07%
|
|
Shot 16
|
231
|
241
|
10
|
4.33%
|
|
Shot 17
|
233
|
212
|
21
|
9.01%
|
|
Shot 18
|
210
|
175
|
35
|
16.67%
|
|
Shot 19
|
200
|
197
|
3
|
1.50%
|
|
Shot 20
|
188
|
199
|
11
|
5.85%
|
| |
|
Average
|
11.65
|
5.61%
|
6 IRON DATA
The 6 iron data was significantly better than the driver data, as none of the shots were more than 10 yards off from the real life distance.
In fact, all but one of them were within 8 yards of the real life total, which helped the average yardage difference to be 3.85 yards, or 2.22% - a significant increase as compared to the driver numbers.
|
Shot
|
Real Life Carry Distance
|
Simulator Carry Distance
|
Yardage Difference
|
Percentage Difference
|
|
Shot 1
|
116
|
113
|
3
|
2.59%
|
|
Shot 2
|
177
|
179
|
2
|
1.13%
|
|
Shot 3
|
156
|
155
|
1
|
0.64%
|
|
Shot 4
|
133
|
136
|
3
|
2.26%
|
|
Shot 5
|
160
|
165
|
5
|
3.13%
|
|
Shot 6
|
176
|
180
|
4
|
2.27%
|
|
Shot 7
|
198
|
189
|
9
|
4.55%
|
|
Shot 8
|
179
|
176
|
3
|
1.68%
|
|
Shot 9
|
172
|
177
|
5
|
2.91%
|
|
Shot 10
|
172
|
176
|
4
|
2.33%
|
|
Shot 11
|
162
|
162
|
0
|
0.00%
|
|
Shot 12
|
189
|
186
|
3
|
1.59%
|
|
Shot 13
|
183
|
182
|
1
|
0.55%
|
|
Shot 14
|
194
|
196
|
2
|
1.03%
|
|
Shot 15
|
183
|
183
|
0
|
0.00%
|
|
Shot 16
|
180
|
183
|
3
|
1.67%
|
|
Shot 17
|
177
|
170
|
7
|
3.95%
|
|
Shot 18
|
176
|
182
|
6
|
3.41%
|
|
Shot 19
|
196
|
204
|
8
|
4.08%
|
|
Shot 20
|
172
|
164
|
8
|
4.65%
|
| |
|
Average
|
3.85
|
2.22%
|
PITCHING WEDGE DATA
After seeing some improvement from driver to 6 iron, we were hoping to see even more improvement to the pitching wedge, but that didn’t quite happen.
However, the data wasn’t all too bad. Three shots were more than 10 yards off, which played a huge factor in inflating the overall average difference up to 5.95 yards, or 4.88%.
The other 17 shots were all within 8 yards of real life carry distance.
|
Shot
|
Real Life Carry Distance
|
Simulator Carry Distance
|
Yardage Difference
|
Percentage Difference
|
|
Shot 1
|
125
|
126
|
1
|
0.80%
|
|
Shot 2
|
123
|
119
|
4
|
3.25%
|
|
Shot 3
|
120
|
123
|
3
|
2.50%
|
|
Shot 4
|
135
|
127
|
8
|
5.93%
|
|
Shot 5
|
117
|
113
|
4
|
3.42%
|
|
Shot 6
|
124
|
118
|
6
|
4.84%
|
|
Shot 7
|
123
|
127
|
4
|
3.25%
|
|
Shot 8
|
129
|
135
|
6
|
4.65%
|
|
Shot 9
|
133
|
135
|
2
|
1.50%
|
|
Shot 10
|
135
|
134
|
1
|
0.74%
|
|
Shot 11
|
126
|
126
|
0
|
0.00%
|
|
Shot 12
|
124
|
138
|
14
|
11.29%
|
|
Shot 13
|
120
|
128
|
8
|
6.67%
|
|
Shot 14
|
111
|
117
|
6
|
5.41%
|
|
Shot 15
|
114
|
135
|
21
|
18.42%
|
|
Shot 16
|
122
|
118
|
4
|
3.28%
|
|
Shot 17
|
132
|
133
|
1
|
0.76%
|
|
Shot 18
|
119
|
133
|
14
|
11.76%
|
|
Shot 19
|
130
|
124
|
6
|
4.62%
|
|
Shot 20
|
135
|
129
|
6
|
4.44%
|
| |
|
Average
|
5.95
|
4.88%
|
Conclusion
The Uneekor EYE MINI is a great portable unit that you can easily take out to the driving range with you. It provides instant feedback, including a club-at-impact replay, right on your mobile device.
The data itself has some room for improvement, but a lot of that can likely be attributed to the windy conditions. We will have to try to fit in amongst our busy schedules another test on a more calm day.
Overall, most of the data wasn’t bad, but a few bad shots can really throw off the data. With the EYE MINI being a newer unit, we imagine the accuracy will continue to improve.


