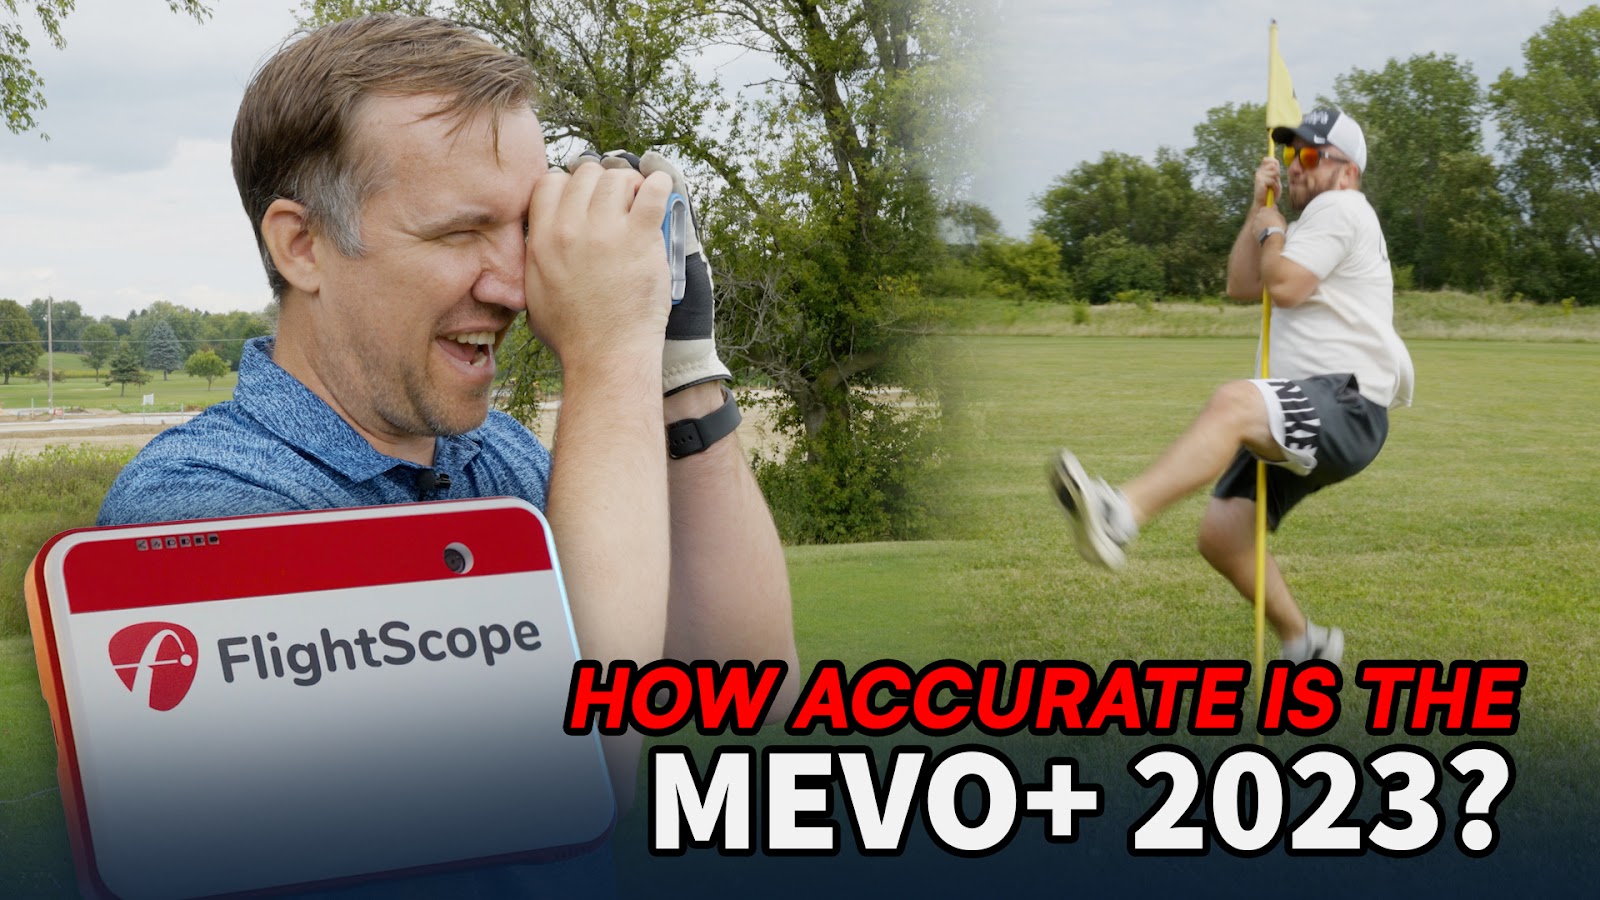
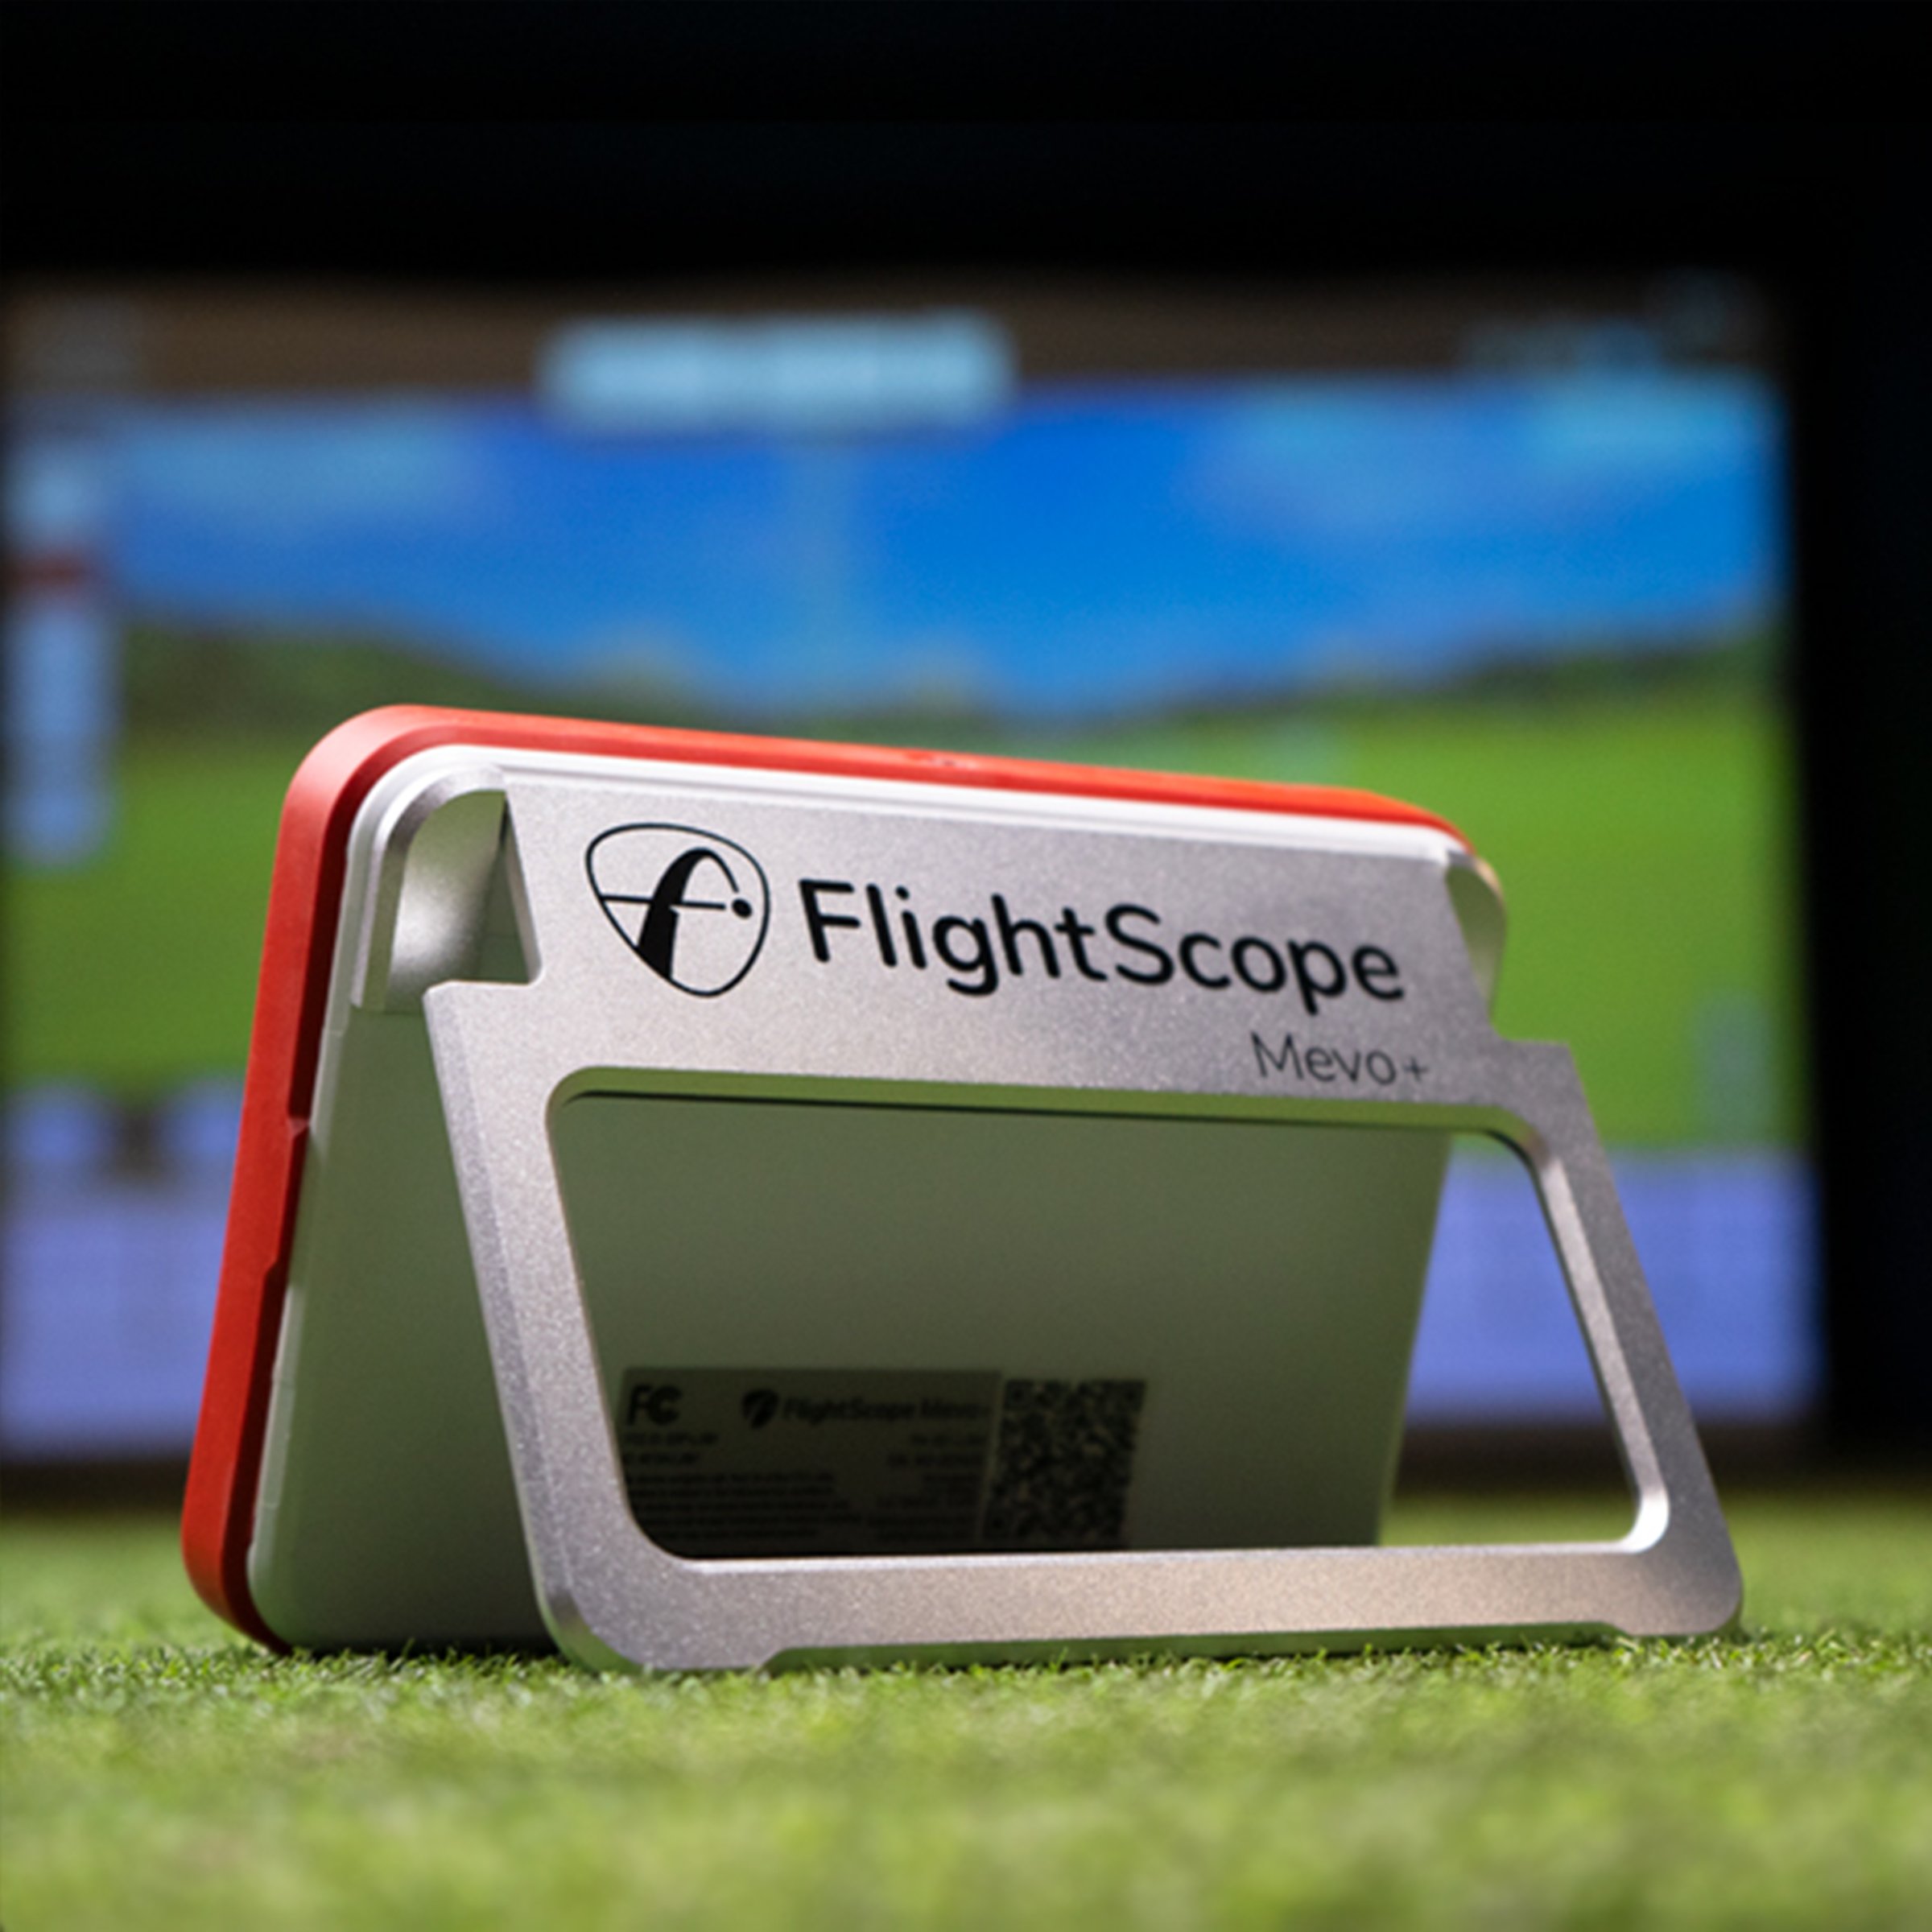
The original FlightScope Mevo+ launch monitor was one of the first devices we took to the range to put its accuracy to the test. FlightScope has recently released an upgraded version called Mevo+ 2023, which, as stated on their website, delivers "performance data you can trust. Mevo+ is the ultimate tracking technology and simulator for game improvement."

In true Carl's Place fashion, we were eager to compare this trustworthy data with the actual results on the driving range. The good news is that the Mevo+ 2023 hasn't undergone significant changes in size, making it still highly portable and easy to set up outdoors at the range.
Setting Up the Mevo+ 2023 Accuracy Test
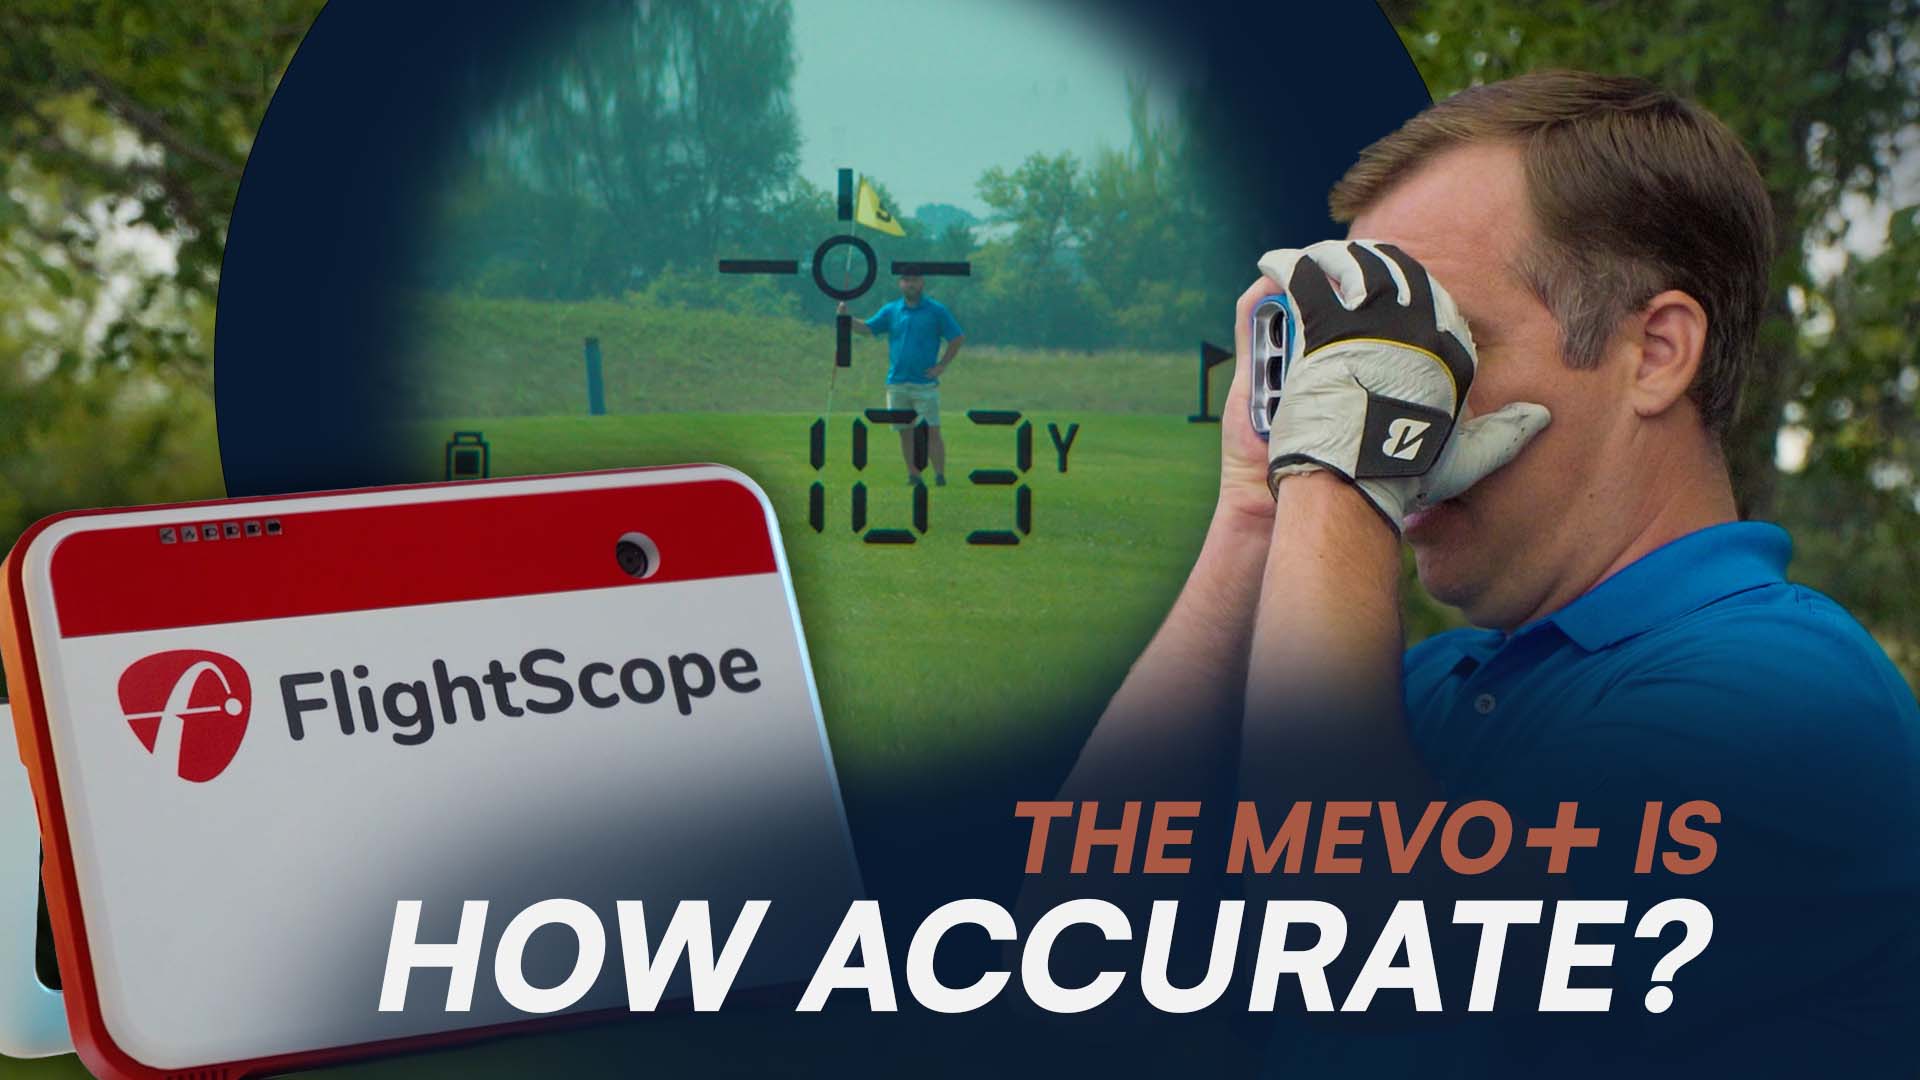
Following our standard testing protocol, Tim from our customer service team took 20 shots each with a driver, 6 iron, and pitching wedge. Meanwhile, Mike from the marketing team tracked and marked the carry distance of each shot in the field. To validate the accuracy, Tim used a rangefinder to measure the real-life distance and compared it with the data provided by the launch monitor.
It's important to keep in mind that numerous factors can influence the numbers at the driving range. These factors include weather conditions, an elevated tee area, and the possibility of human error when spotting the ball. It was a pretty windy day, and we did change the wind in the FlightScope app to match that of the real life wind.
Please find all of our collected data below, and feel free to explore our other driving range accuracy tests:

Mevo+ 2023 Accuracy Test Data
DRIVER DATA
The driver data from the Mevo+ 2023 was relatively inconsistent, but that can be attributed to the weather. We’re assuming that the ones that are significantly off were because the wind died down or kicked up faster than we had the software set to.
Due to those tough conditions and inconsistent numbers, the average yardage difference for the driver was 12.35 yards, which was 5.76%. We feel on a calmer day, this would be much more consistent and accurate.
As you take a look at the data below, you'll see that on shot 11, Mike forced Tim to switch to a 3 wood because the tail wind was causing his drives to leave the range and making it nearly impossible to locate the balls.
|
Shot
|
Real Life Carry Distance
|
Simulator Carry Distance
|
Yardage Difference
|
Percentage Difference
|
|
Shot 1
|
200
|
194
|
6
|
3.00%
|
|
Shot 2
|
222
|
189
|
33
|
14.86%
|
|
Shot 3
|
197
|
166
|
31
|
15.74%
|
|
Shot 4
|
214
|
221
|
7
|
3.27%
|
|
Shot 5
|
232
|
238
|
6
|
2.59%
|
|
Shot 6
|
244
|
250
|
6
|
2.46%
|
|
Shot 7
|
248
|
254
|
6
|
2.42%
|
|
Shot 8
|
257
|
259
|
2
|
0.78%
|
|
Shot 9
|
245
|
253
|
8
|
3.27%
|
|
Shot 10
|
246
|
238
|
8
|
3.25%
|
|
Shot 11 (start of 3W)
|
218
|
180
|
38
|
17.43%
|
|
Shot 12
|
203
|
215
|
12
|
5.91%
|
|
Shot 13
|
189
|
202
|
13
|
6.88%
|
|
Shot 14
|
217
|
211
|
6
|
2.76%
|
|
Shot 15
|
243
|
240
|
3
|
1.23%
|
|
Shot 16
|
245
|
245
|
0
|
0.00%
|
|
Shot 17
|
250
|
251
|
1
|
0.40%
|
|
Shot 18
|
198
|
224
|
26
|
13.13%
|
|
Shot 19
|
210
|
231
|
21
|
10.00%
|
|
Shot 20
|
241
|
227
|
14
|
5.81%
|
| |
|
Average
|
12.35
|
5.76%
|
6 IRON DATA
After a tough start with two of the first three shots being more than 10 yards off, the Mevo+ 2023 honed in and really did well with the 6 iron data.
After the tough start, none of the shots were more than 8 yards off, which led to a 4.75 yards difference, good enough for 2.54%. Very solid data considering the blustery conditions.
|
Shot
|
Real Life Carry Distance
|
Simulator Carry Distance
|
Yardage Difference
|
Percentage Difference
|
|
Shot 1
|
187
|
203
|
16
|
8.56%
|
|
Shot 2
|
184
|
181
|
3
|
1.63%
|
|
Shot 3
|
194
|
207
|
13
|
6.70%
|
|
Shot 4
|
194
|
197
|
3
|
1.55%
|
|
Shot 5
|
153
|
151
|
2
|
1.31%
|
|
Shot 6
|
136
|
138
|
2
|
1.47%
|
|
Shot 7
|
187
|
190
|
3
|
1.60%
|
|
Shot 8
|
210
|
209
|
1
|
0.48%
|
|
Shot 9
|
198
|
195
|
3
|
1.52%
|
|
Shot 10
|
214
|
207
|
7
|
3.27%
|
|
Shot 11
|
205
|
210
|
5
|
2.44%
|
|
Shot 12
|
172
|
170
|
2
|
1.16%
|
|
Shot 13
|
188
|
196
|
8
|
4.26%
|
|
Shot 14
|
177
|
180
|
3
|
1.69%
|
|
Shot 15
|
160
|
156
|
4
|
2.50%
|
|
Shot 16
|
192
|
191
|
1
|
0.52%
|
|
Shot 17
|
190
|
195
|
5
|
2.63%
|
|
Shot 18
|
169
|
166
|
3
|
1.78%
|
|
Shot 19
|
210
|
206
|
4
|
1.90%
|
|
Shot 20
|
187
|
194
|
7
|
3.74%
|
| |
|
Average
|
4.75
|
2.54%
|
PITCHING WEDGE DATA
The data from the pitching wedge was closer in average yardage, but percent was a little worse than the 6 iron. However, it had no shots that read more than 10 yards different, which was a great sign.
The average difference for the pitching wedge data was 4.65 yards, or 3.7%.
|
Shot
|
Real Life Carry Distance
|
Simulator Carry Distance
|
Yardage Difference
|
Percentage Difference
|
|
Shot 1
|
139
|
136
|
3
|
2.16%
|
|
Shot 2
|
134
|
138
|
4
|
2.99%
|
|
Shot 3
|
136
|
145
|
9
|
6.62%
|
|
Shot 4
|
131
|
139
|
8
|
6.11%
|
|
Shot 5
|
137
|
144
|
7
|
5.11%
|
|
Shot 6
|
131
|
129
|
2
|
1.53%
|
|
Shot 7
|
116
|
120
|
4
|
3.45%
|
|
Shot 8
|
100
|
102
|
2
|
2.00%
|
|
Shot 9
|
118
|
119
|
1
|
0.85%
|
|
Shot 10
|
117
|
125
|
8
|
6.84%
|
|
Shot 11
|
117
|
121
|
4
|
3.42%
|
|
Shot 12
|
130
|
135
|
5
|
3.85%
|
|
Shot 13
|
125
|
128
|
3
|
2.40%
|
|
Shot 14
|
128
|
121
|
7
|
5.47%
|
|
Shot 15
|
130
|
137
|
7
|
5.38%
|
|
Shot 16
|
126
|
118
|
8
|
6.35%
|
|
Shot 17
|
124
|
120
|
4
|
3.23%
|
|
Shot 18
|
99
|
96
|
3
|
3.03%
|
|
Shot 19
|
128
|
125
|
3
|
2.34%
|
|
Shot 20
|
116
|
115
|
1
|
0.86%
|
| |
|
Average
|
4.65
|
3.70%
|
Conclusion
Based off the testing we did, it’s hard to come to a conclusion on the accuracy of the Mevo+ 2023 just because of how windy it was. Of course, we would ideally want a perfectly calm day with no weather interference, but that just doesn’t happen enough in Wisconsin.
So, going off the numbers, the Mevo+ 2023 was a little worse than the original Mevo+. However, on a calm day, we would imagine those numbers would be much closer or even better than the original.
Either way, the Mevo+ 2023 offers solid accuracy and some awesome other features that you can only get on much more expensive launch monitors. It is still a great value.


